Mastering Forecasting in Excel: A Strategic Approach
Introduction Excel’s Forecasting feature, bolstered by AI, is an invaluable tool for predicting
trends and making data-driven decisions. This blog will guide you through utilizing this feature to
enhance your forecasting capabilities.
Using Forecasting in Excel
1. Data Preparation: Input historical data relevant to what you’re forecasting.
2. Selecting the Data: Highlight the data set for which you want to create a forecast.
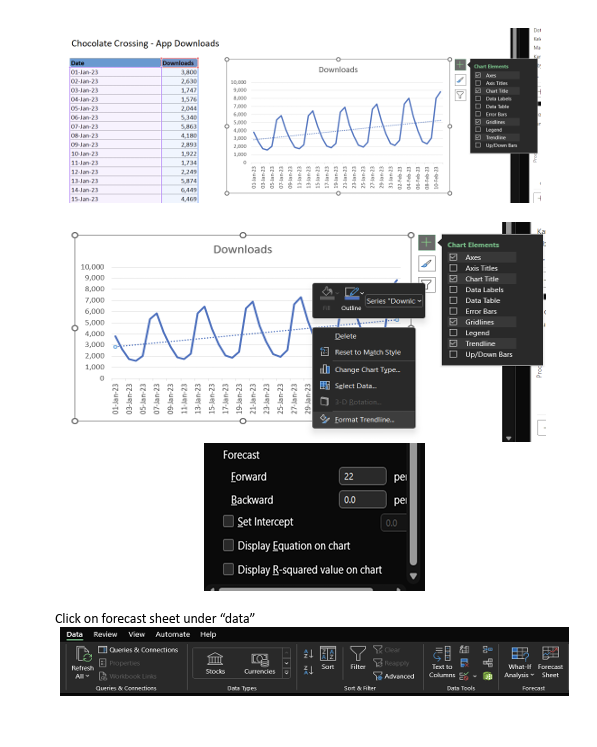
3. Accessing the Forecast Tool: Find and select the ‘Forecast Sheet’ option in the ‘Data’ tab.
4. Customizing the Forecast: Adjust the forecast end date and other settings to suit your needs.
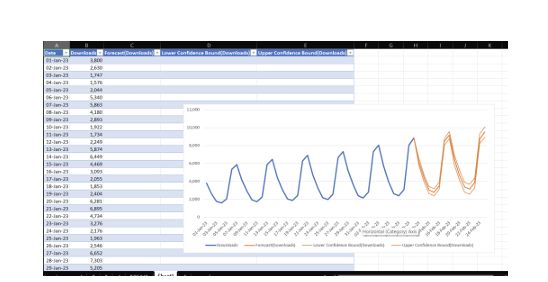
5. Analyzing the Forecast: Review the forecasted data generated by Excel, displayed as a graph
and a table.


Sales Forecasting for a Retail Chain You’re a manager at a retail chain, tasked with forecasting next
quarter’s sales.
1. Gathering Historical Sales Data: Compile past sales data into Excel.
2. Creating the Forecast: Use the Forecasting tool to predict next quarter’s sales based on
historical trends.
3. Strategic Planning: Utilize the forecast to plan inventory, staffing, and marketing strategies for
the upcoming quarter.
This feature provides a robust, data-driven foundation for strategic planning and decision-making.
Related Posts
link slicers to two pivot tables based on the same data source
Centralized View – Connect one Slicer to two pivot tables OverviewSometimes you may need…
Unlocking Insights: A Guide to AI Assistant_Insights in Excel
1-Visit https://chat.openai.com/ and sign up for an OpenAI account. Setup an OpenAI…
Bridging Data Gaps: A Deep Dive into AIAssistant_FillData in Excel
1-Visit https://chat.openai.com/ and sign up for an OpenAI account. Setup an OpenAI…
Unlocking Seamless Translations in Excel
1-Visit https://chat.openai.com/ and sign up for an OpenAI account. Setup an OpenAI…

Leave a Reply